Introduction
 It is a significant challenge to suggest how a Canadian pork producer in today’s economic environment can turn a loss into a profit. Indeed the “perfect storm” of pork prices, exchange rate and input costs have made losses of $30-$50/hog the norm over the last several months. It is the intent of this paper to reinforce production practices, backed by research and actual commercial practice, that can produce savings of not just $2-3 per market animal but multiples of that. Too often do we hear “I am doing everything possible already” in reference to cutting costs. Production systems are living entities with fluctuations in productivity, management and staff that are overwhelmed with daily distractions and in-barn procedures which evolve whether you want them to or not. There are opportunities, and every dollar saved is one less dollar borrowed under the present conditions. The following is a checklist to take to the barn and help you evaluate where the opportunities exist in your operation.
The focus is on the cost areas with the greatest potential for payback for the efforts invested. These are in order of importance and relative size of annual expenditure: feed (52.7%), wages & benefits 11.2%, and utilities & fuel 4.7%. These three account for nearly 70% of all expenditures on a typical farm in western Canada in 2007, so our approach to addressing costs will be confined to these areas.
Feeding Program
This begins with defining the objective of the feeding program that can be any one of the six objectives in Figure 1.
Figure 1: Objectives of a feeding program
1. Maximize return over feed cost/pig sold
2. Maximize return over feed cost/year
3. Maximize expression of genetic potential
4. Achieve specific carcass characteristics
5. Achieve specific pork characteristics
- Minimize operational losses
Action #1: Feeding program objectives must be clearly defined;
Objectives can and indeed will change over time |
The purpose of defining the program makes it possible for the nutritionist to assist in diet formulation and ingredient selection to achieve that end. So the first opportunity for cost reduction is – Are we formulating to minimize operational losses? This includes a review of selecting optimum energy levels, defining lysine:energy ratios, defining the ratio of other amino acid levels to lysine, setting mineral levels (even withdrawing in late stage finisher diets) and making use of opportunity ingredients. The outcome should be a feed budget similar to Figure 2. The regular matching of actual feed usage by diet type to the budget is the exercise in Figure 3 which shows that after a 5 month period in fact this 600 sow farrow-to-finish farm had excessive use of some of the most expensive diets on the farm and resulted in an average cost increase of almost $6 per market hog. But the owner thought they were doing “everything they could” because they had a competitive feed budget. The problem was not the budget but the fact it was not being adhered to for any number of reasons, perhaps as simple as not explaining to the person making or delivering the feed that the number of pigs in the nursery was below budget, in this case because of a PCVAD outbreak.
Figure 2: Example of a typical western Canadian feed budget
Diet Pig Wt., Days A.D.G., A.D.F.I., Feed,
kg g/d g/d kg/pig kg.pig kg/pig
St #1 6 4 115 125 0.5
St #2 7 to 8 6 300 330 2.0
St #3 8 to 14 13 475 620 8
St #4 14 to 22 13 600 870 11
St #5 22 to 35 17 765 1,224 21
Gr #1 35 to 50 16 865 1,900 31
Gr #2 50 to 65 16 920 2,300 38
Fi #1 65 to 80 16 930 2,600 46
Fi #2 80 to 95 16 930 2,850 46
Fi #3 95 to 105 11 880 3,000 38
Fi #4 105 to Mkt 12 830 3,000 32
Figure 3: Reconciliation of actual feed usage versus budget
Diet Budget Actual (5 month avg)
Wean diet 2.5 3.3*
Starter 1 8 9.1*
Starter 2 11 12.8*
Starter 3 21 23.4*
Grower 1 31 40.1*
Grower 2 38 43.3*
Barrow fin1 46 41.6
Barrow fin2 46 42.9
Barrow fin3 38 43.1*
Barrow fin-mkt 32 46.5*
Gilt fin1 46 48.0
Gilt fin2 46 46.6
Gilt fin3 36 46.1*
Gilt fin-mkt 30 47.4*
Gestation 37 18.1
Lactation 22 18.3
Cost/pig marketed $83.42 $89.35
Difference $5.93
Numbers in RED* are greater than 10% over budget
Other aspects of the feeding program that need to be evaluated include evaluating the energy content of the final diets and implementing the Net Energy system to seek further savings by crediting the most accurate energy value available to each ingredient. Reformulating frequently is important when commodity prices move up or down. The general “rule of thumb” is to reformulate whenever the main grain and protein ingredients move by a pre-determined amount (for example $5-10 per metric tonne).
Alternative feed ingredients at times can be the single largest opportunity to reduce feed costs. This includes co-products of the ethanol, bakery and food processing industry but also includes common ingredients like corn. Currently in western Canadian diets implementing a change from wheat to corn could save as much as $4-5/pig marketed depending on your local cost of wheat.
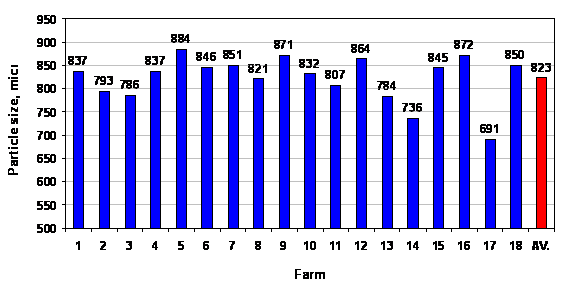
Once the diet has been formulated there are still opportunities to reduce costs by observing particle size stays within the 650-700 micron range to ensure optimum digestibility. Frequently, due to screen wear, improper screen size or hammer wear, the feeds milled on farm are significantly over the 700-micron threshold (surveys show a range of particle size 700-900 microns – Figure 4). For every 100 microns under 700 the feed conversion improves 1.2%. With feed costs today of $80 per finished hog, moving from say a 3.0 F/G to a 2.96 F/G (the effect of 1.2% improvement, or 100 micron reduction in feed particle size) is worth $1.00 per pig marketed.
Figure 4: On-farm survey of average feed grain particle size
| Target of 650 um |
From: Stirdon Betker, Alberta
Please view our Survival Strategies publications on our website www.prairieswine.ca for more tips like:
- Moving from 2 phases to 4 phase feeding programs can easily save $1-2/pig
- Trace minerals and vitamins can be removed from last three weeks of finishing diet (not for gilts for breeding or pigs on Paylean)
- Use of phytase and reduction of dicalcium phosphate in diet has saved $0.50 per pig or more under some market conditions
Labour
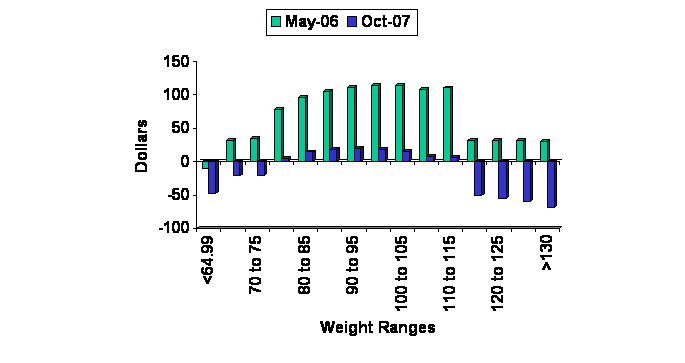
Which is more important – breeding sows or shipping pigs? Although the question is not really which is more important, it does point to the two areas where our people have a significant impact in our success as a production unit. Figure 5 shows one farm’s analysis of how management and labour have to respond when market conditions change. The most profitable hog in May 2006 provided a carcass of 100-105 kg whereas that same farm maximized returns by dropping carcass weights 5kg in October 2007 in response to declining hog prices and increasing feed prices. Once the new target is established, consistently hitting the target is important. Unfortunately many packers still report that only 66% of the hogs they receive fall into “core”. This is unfortunate since weighing, marking and forecasting growth rates should allow the personnel to hit 85% in core consistently. The loss due to this slippage is approaching $2.00 per hog marketed.
Figure 5: On farms analysis of carcass weight relative to returns at two time periods
Action #8: In May, 2006, return over feed cost was maximized in carcasses weighing 100 to 105 kg; in October, 2007, returns were maximized in carcasses weighing 95 to 100kg
Utilities
Utilities are the third largest expense in pork production after feed and labour. This cost area has seen significant increases across Canada over the past 5 years. In 2003 we did extensive analysis on the effect of ventilation rate and set point temperature adjustments that can save on energy costs. At the time we found losses of $1 per pig marketed were likely when a finishing barn was over-ventilated by just 10% in the winter. Today electricity prices are three times what we paid in 2003. Our opportunity for savings of up to $3 per hog marketed is possible by ensuring our ventilation systems are performing properly.
An extensive analysis of utility costs is being undertaken in a variety of barns across Saskatchewan. The initial results reported in Figure 6 show that the range of energy use is four fold across various farrow-to-finish operations. Although disappointing for those farms at the high end, it does indicate that there is significant opportunity to reduce costs incurred for utilities – at least $3-5 per pig marketed. Some of the differences contributing to these vast differences in cost include:
- Limit use of heat lamps in farrowing and move to heat mats
- Move from incandescent to T-8 fluorescent bulbs
- Reduce the number of hours of light or amount of light in nursery and grow finish rooms
- When fans need replacing select new ones on the basis of energy efficiency
Figure 6: Survey showing range in energy use across farm types
– Energy, $/100kg pig, over 3 years
Barn type No. of barns Mean Min Max
Farrow-finish 8 6.76 3.31 12.24
Nursery 2 1.70 1.36 2.48
Finish 4 1.35 0.95 2.07
Farrow 2 13.08 11.83 13.93
Farrow-nursery 2 16.21 8.93 23.06
Nursery-finish 1 2.66 1.71 4.06
Additional information will be forthcoming in this area as research uncovers the hidden profit robbers hiding in our utility bills.
Most farms don’t receive a water bill but waste here also contributes to farm costs. Scientific and industry surveys both point to the fact that about 40% of the water delivered to the nipple is wasted. This wasted water ends up as slurry and increases our manure hauling costs by at least $0.70 per pig. The things to look for:
- In a recent survey 20-70% of nipples provided flow rates in excess of recommendations. This excess water is beyond the pig’s capacity to consume it resulting in higher waste.
- Water disappearance is 34% less on wet/dry feeders compared to dry feeders and wall mount nipples.
- Nipples installed at 90o to the wall should be located at shoulder height; nipples located 45o to the wall should be 2 inches above shoulder height (a well-positioned nipple will reduce water wastage to 25% of total volume delivered).
- Replacing nipple drinkers with swing drinkers, bite-ball nipples or bowls has also been shown to decrease wastage.
Productivity
When prices are low and losses are high it is easy to turn our attention away from the demanding management of sow reproduction, “so what if we wean a few less pigs, they are not worth anything any way”. However each pig contributes to carrying the overhead of all those fixed costs our barns incur. Actually, outside of feed and trucking, most costs are fixed in our systems so the impact of sow productivity can be profound. For example, in November we completed an analysis asking what if we move from 22 pigs weaned (20.7 pigs sold) per year to 28 pigs weaned (26.3 pigs sold) per year? During this November period our breakeven price for producing a market hog dropped from $1.60/kg to $1.47/kg when looking at just the impact of sow productivity.
Conclusions
There are opportunities for savings on every farm in Canada. Finding these savings takes a methodical and careful process of comparing our targets to what we are actually achieving – doing this on a regular basis will frequently find opportunities to save. Perhaps savings of $15/hog are possible. These savings don’t all exist on all farms but some of them exist on some farms and it is our job to find them and correct them. Then next month look again and find those that escaped our gaze the first time, and be committed to doing it over and over again as we work to maintain margins in a challenging commodity market.
Pork Insight was developed to address producer and industry needs for timely and accurate information related to pork production and is designed to help you find the information to help you fine -tune your operation. The Pork Insight database can be found online at www.prairieswine.com
Survival Checklist
| Action # 1: Feeding program objectives must be clearly defined; objectives can and indeed will change over timeAction # 2: Selecting the correct dietary energy concentration can lower costs by $1 – $13 per pigAction # 3: Adoption of Net Energy system for diet formulation can reduce feed costs by $1 and $5 per pig.
Action # 4: Aggressive adoption of a variety of ingredients can reduce feed costs by up to $5 per pig Action # 5: Regular re-formulation of diets can reduce feed costs by $3 to $4 per pig. Action # 6: Tracking implementation of feed budget can reduce costs by $5 per pig. Action # 7: Cost of particle size deviation from target can exceed $1 per pig. Action # 8: In May 2006, return over feed cost was maximized in carcasses weighing 100-105 kg, in October 2007, that same farm found returns maximized in carcasses weighing 95-100 kg. Action # 9: Achieving 85% in core, rather than 66% in core would increase return over feed costs by up to $1.80 per pig Action # 10: Increased sow productivity (from 22-28 p/s/y) can reduce breakeven $13/ckg or about 10%. Action # 11: Operating procedures and equipment can both contribute to excess power consumption. Turn lights off, switch to heat mats and reduce heat lamp use. Action # 12: Improper minimum ventilation (10% above requirement) adds up to $3 per pig Action # 13: On average 40% of water delivered to the nipple is wasted, that is an additional $070/pig in slurry hauling costs. |


